What is Gantt chart in Projects?
In this fast-moving world of project management, the race is always on between meeting deadlines and maintaining resources. Here comes the Gantt chart that has turned upside down the way teams plan, execute, and monitor projects with this dynamic visual tool. But first, just what are these Gantt charts, and why are they such a big deal in today's project management?
Understanding Gantt Charts
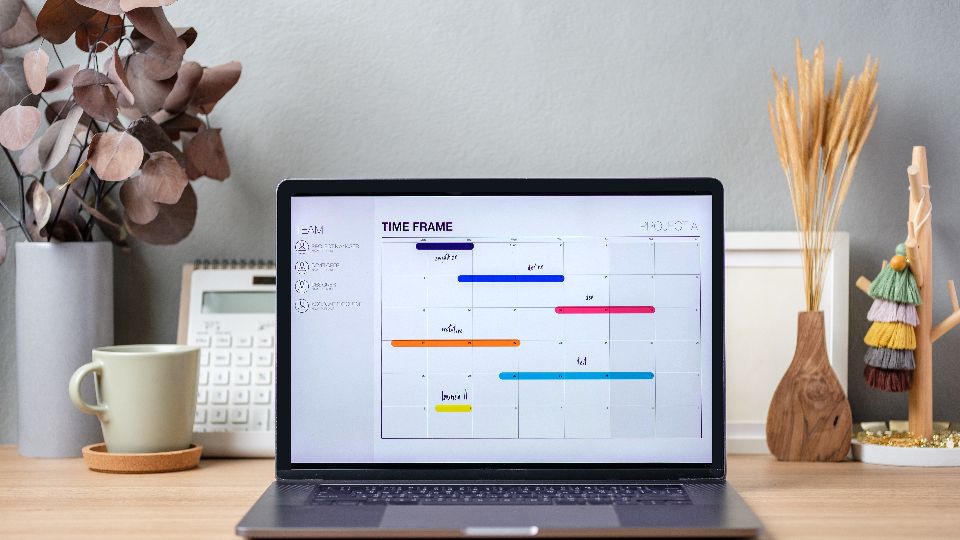
A Gantt chart is essentially a horizontal bar chart that represents the schedule of a project. Named after Henry Gantt, who was responsible for popularizing this technique early in the twentieth century, these charts give a clear, visual overview of tasks, timelines, and dependencies of a project. Each bar in the chart defines one task, with the length of the bar representing the duration of the task.
Gantt Chart Key Components
- Tasks: This is the backbone for any project set vertically.
- Timeline: This usually runs horizontally and represents the duration the project will take.
- Bars: These are visualization tools used to show the span of each task's progress.
- Milestones: These are major events that occur in the process of project execution, or deadlines.
- Dependencies: These are arrows showing the relationship between tasks.
Benefits of Using Gantt Charts
- Visual Clarity: Gantt charts provide at-a-glance visualization of the whole timeline of a project, hence enabling team members and stakeholders to gain appropriate insight into the progress and possible upcoming activities concerning the projects.
- Resource Management: By clearly showing the duration of tasks and when they overlap, Gantt charts support managers in resource allocation by avoiding over-allocation of resources and further bottlenecks.
- Dependency Tracking: With arrows linking related tasks, it is fairly easy to see how delays in one area may impact the overall project timeline.
- Flexible Planning: Gantt charts update quickly when projects change, enabling agile project management.
- Better Communication: The visual displays drive more productive conversations between team members and clients, ensuring everyone is on the same page.
How to Use Gantt Charts Effectively
To achieve the full potential of Gantt charts, they need to be updated and shared continuously with all team members. Regular reviews and updates will ensure that the chart remains a trusted tool throughout the project's life cycle.
Why Vabro?
While Gantt charts are powerful, their effectiveness is taken to a whole new level when integrated into a strong project management solution. That is where Vabro Project Management Software comes in—providing an online platform with not only an intuitive way of creating and managing Gantt charts but also seamless integration with other key project management tools.
Manage tasks with drag-and-drop ease, collaborate on them in real-time, and track their progress automatically through the intuitive interface of Vabro. What's more, unlike other solutions, Vabro provides you with personalized templates to meet the demands of a variety of industries, so that you can be up and running in no time