Mastering Project Timelines with Gantt Charts: A Comprehensive Guide
In the ever-evolving landscape of project management, one tool has consistently stood out for its effectiveness in visualizing timelines and tracking progress: the Gantt chart. Whether you’re managing a complex project with multiple stakeholders or a straightforward task with a tight deadline, Gantt charts provide a clear, graphical representation of your project’s schedule. As a seasoned professional with over a decade of experience in project management, I’ve seen how Gantt charts can transform the way teams approach planning and execution. In this blog, we’ll explore the benefits of using Gantt charts and how integrating them with advanced tools like Vabro can take your project management to the next level.
What is a Gantt Chart?
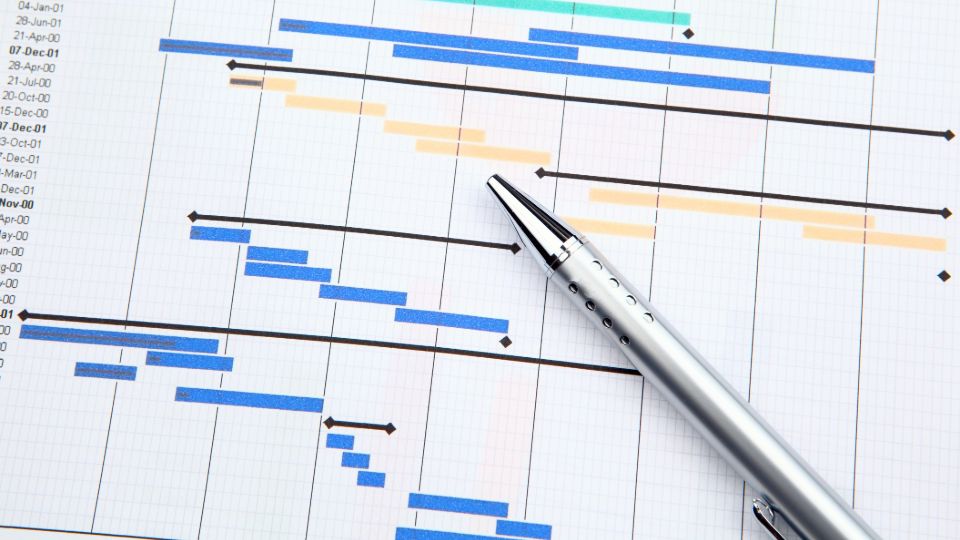
A Gantt chart is a kind of bar chart that illustrates a project schedule over time. An activity or task is represented by a horizontal bar. It is used to represent the timing of when the activity has to occur. It demonstrates not only how long each task is going to take but how they all relate to each other, thus enabling the detection of dependencies, overlaps, and possibly bottlenecks.
Gantt Chart Advantages
Visible Project Timelines: The first and foremost advantage of Gantt charts is that they can graphically present a project's timeline from the beginning to its end. It allows the project manager and all the team members to understand, at a glance, the entire sequence of any task and its time dimension.
Task Dependencies and Their Critical Path: Gantt charts work out the task dependencies, thus identifying a critical path—the succession of dependent tasks determining the overall duration of a project. Indeed, the most critical piece in grasping the critical path is ensuring that your project will stay on track.
Resource Allocation: Gantt charts help allocate the right resources at the right time by visualizing the project timeline. You can easily determine when you will need a particular team member or resource without much over-allocation or conflicts.
Progress Tracking: Gantt charts are very useful for tracking progress. Completed tasks are clearly shown along with those in progress or yet to start. Such visualization allows you to keep track of deadlines and make necessary changes.
Vabro: Extending the Power of Gantt Charts
All in all, basic Gantt charts can take you very far on their own. But the incorporation of them into advanced project management software like Vabro brings about a world of difference. With Vabro's powerful Gantt chart functionality, it easily integrates into your project workflows.
Dynamic Gantt Charts: Vabro's Gantt chart tool is dynamic; that is to say, every time a task is completed, deadlines are shifted, or new tasks are added, the Gantt chart will change in real time, keeping your project timeline up to date and accurate.
Task Dependencies and Collaboration: Vabro allows for easy management of task dependencies directly in the Gantt chart. Moreover, team members are able to collaborate in the software by adding comments, updates, or attachments to a particular task, which become visible from the Gantt chart view.
Agile Methodologies Integration: The best thing about Vabro is that a Gantt chart easily integrates with Agile project management practices. Though a Gantt chart is traditionally related to Waterfall methodologies, Vabro makes it easy to plug them into Agile workflows, ready to serve as a hybrid that brings the best of both worlds.
Comprehensive Reporting and Analytics: Vabro's Gantt chart tool is embedded with advanced reporting and analytics features. Print detailed reports on the progress of tasks and resources allocated to projects, with printable project timelines, to make data-based decisions and streamline your project management process further.
Best Practices in Applying the Gantt Chart to the Project Plan
Break Down Tasks: Don't forget to break down your tasks into units that are manageable. It makes your Gantt chart more detailed and also helps in better tracking and execution.
Regular Updates: Keep updating your Gantt chart to reflect your project's real state. This will assist you in recognizing possible delays ahead of time and taking relevant measures to adjust your plan.
Use Milestones: Place milestones to indicate important phases of the project's timeline. This keeps the team on course and gives them a visible mark of progress.
Utilize All the Features Provided by Vabro: In Vabro, use its Gantt chart to make the best of collaboration, dependencies tracking, and view progress on a deeper level.
Conclusion
Gantt charts are a core tool for project managers, as they represent a project timeline, the dependencies between tasks, and the progress. Similarly, integration with a leading-edge project management tool such as Vabro will enhance project management in several dimensions: efficiency, cooperation, and success. Whether dealing with a complex project or a simple task, embracing the synergy of Gantt charts and Vabro empowers you to deliver quality results on time and within scope.