How to Create a Gantt Diagram?
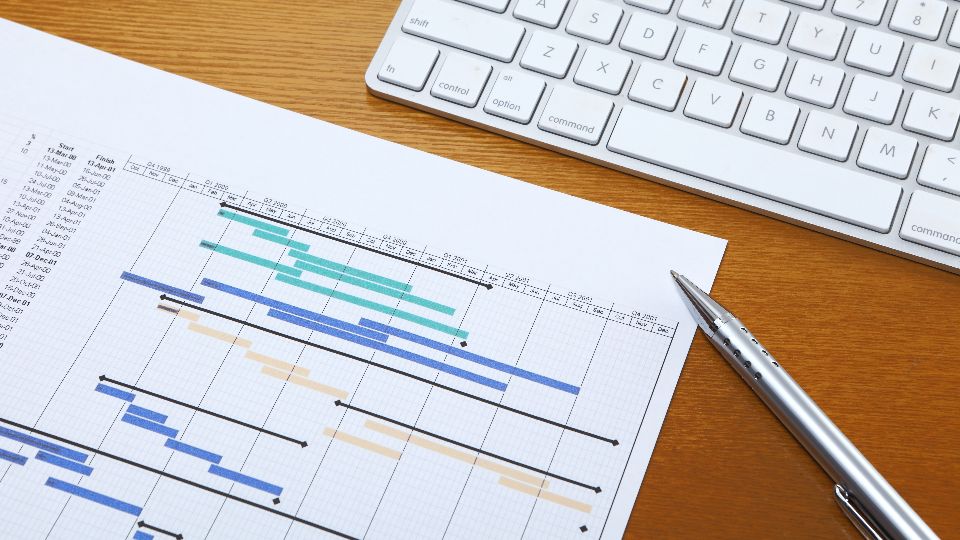
A Gantt diagram, or Gantt chart, is a popular project management tool that helps visualize project timelines, tasks, and progress. It consists of horizontal bars representing tasks, with the length of each bar indicating the task’s duration. Gantt charts are essential for project managers to keep track of deadlines, task dependencies, and overall project flow. Here’s a step-by-step guide on how to create one.
Step-by-Step Guide to Creating a Gantt Diagram
Define Your Project and Tasks
Overview: Start by outlining your project’s key tasks and subtasks. Make sure to break them down into manageable steps, ensuring that each task has a clear start and end date.
Tip: Include dependencies—tasks that must be completed before others can begin.
Set Task Durations
Overview: For each task, estimate the amount of time it will take to complete. You’ll use this to determine how long each bar on the Gantt chart should be.
Tip: Be realistic with your time estimates to avoid project delays.
Determine Task Dependencies
Overview: Identify which tasks depend on others and plan the order in which tasks need to be completed. These dependencies should be visualized in the Gantt chart using connectors or arrows.
Tip: Highlight tasks that can be done concurrently to optimize the timeline.
Create the Gantt Diagram
Overview: Use a tool like Excel, Google Sheets, or a project management platform like Vabro to create your Gantt chart. Most tools provide templates where you can input tasks, durations, and dependencies.
Tip: Color-code your tasks for better clarity and organization.
Monitor Progress
Overview: As the project progresses, update your Gantt chart to reflect completed tasks, delays, or changes in dependencies.
Tip: Regularly review your Gantt chart with your team to ensure that everyone is aligned.
Why Vabro Is Better?
Vabro offers built-in Gantt chart functionality, making it easy to create, modify, and track project timelines. Vabro allows you to define tasks, set dependencies, and monitor progress in real-time. With its user-friendly interface and powerful automation, Vabro simplifies the process of managing complex projects. Additionally, Vabro integrates Gantt charts with other Agile tools like Kanban boards and Scrum boards for a comprehensive project management experience. Learn more about Vabro’s project management tools on the Features page or discover why Vabro is the best choice for managing your projects.
Conclusion
Creating a Gantt diagram is a powerful way to keep your project organized and on track. By following the steps outlined above and using tools like Vabro, you can ensure that your project is well-planned, timelines are clear, and progress is easily monitored.
