Gantt Diagram Software
Gantt diagram software is indispensable in the realm of project management, as it graphically designates the timeline of activities, milestones, and phases of projects. It enables teams to strategize, organize, and track project progress, so that everything remains on course and within scope. In such light, project managers can use Gantt diagrams to pinpoint impending bottlenecks, distribute resources more cautiously, and keep all stakeholders updated with information regarding the status of a particular project.
What is a Gantt Diagram?
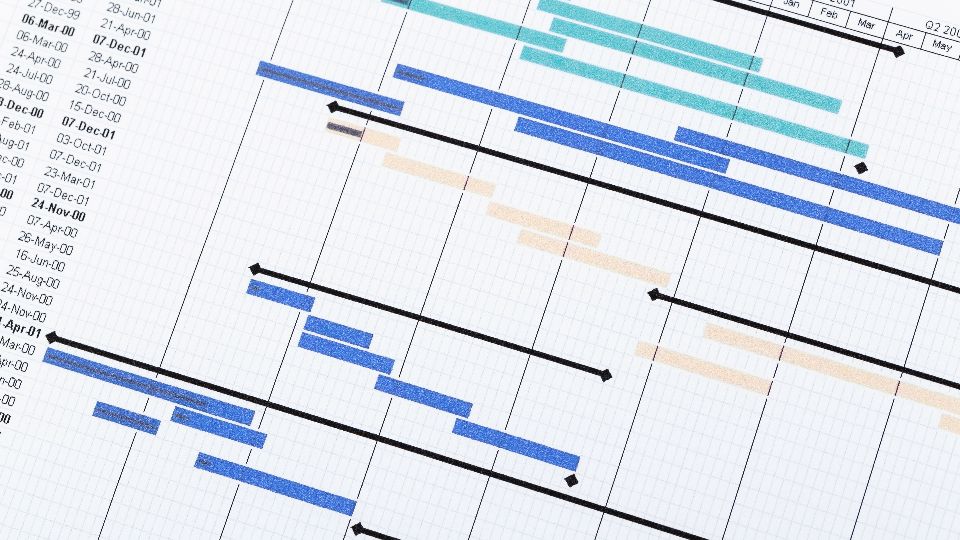
A Gantt diagram, also called a Gantt chart, is a form of bar chart that illustrates a project schedule. It consists of a graph in which tasks or activities are listed along the vertical axis, and time runs along the horizontal axis. Each task then appears as a bar whose length indicates the duration of the task. The dependency relationships between tasks may also be shown, including which tasks must be completed before another can start.
Benefits of Gantt Diagram Software
Visual Clarity: Gantt diagrams are crystal clear visually in representing a project timeline; thus, allowing clear and straightforward comprehending of complex project plans with just a glance. Such clarity can specifically be valuable when dealing with big projects that retain many elements.
Task Management: Gantt diagram software allows project managers to break down the project into manageable tasks, allocate these tasks among team members, and define the deadline for completion of the tasks. This minute level of planning ensures that everything related to the project is considered.
Resource Allocation: By observing the whole project timeline, managers will be able to plan resources effectively; team members will not be overburdened, and resources will be available when they are needed.
Progress Tracking: Gantt diagrams depict a very simple way of tracking the progress of each and every task, as well as the entire project. As tasks get completed, in real time, the chart can be updated to show an updated view into the status of the project.
Communication: Gantt diagrams are a very good source of communication for the project managers in order to convey the timelines and progress regarding the particular projects to the stakeholders. This helps in aligning up everyone who is involved with the project and informed.