What Is a Gantt Chart? Examples + Quick-to-Use Template
A Gantt chart is a powerful visual tool used in project management to plan, track, and monitor project progress. It provides teams with a comprehensive overview of tasks, durations, dependencies, and milestones, helping them stay on track and meet deadlines. Here’s everything you need to know about Gantt charts and how to use them efficiently.
What Is a Gantt Chart?
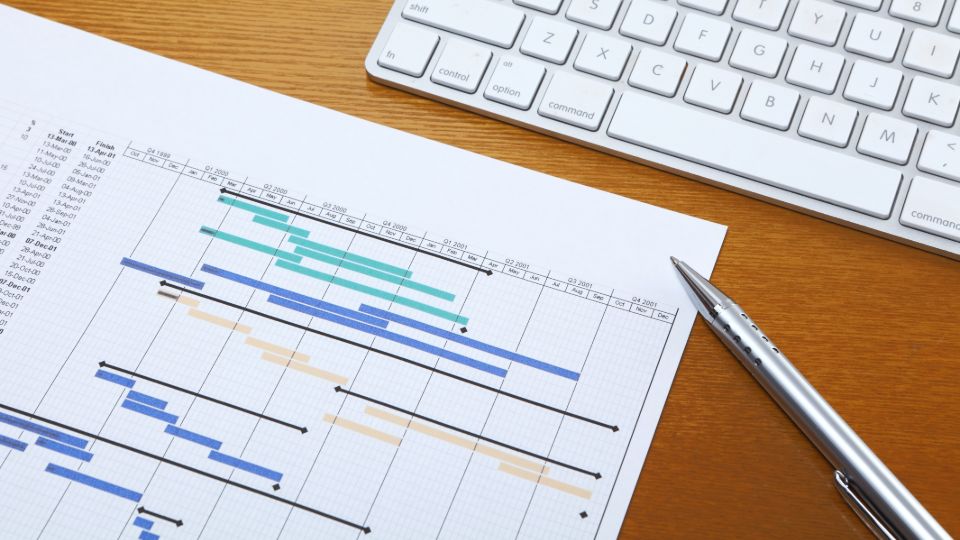
A Gantt chart is a horizontal bar chart that represents tasks over time. It breaks a project into manageable activities, displaying their start and finish dates. This structured timeline allows teams to visualize their schedules and track progress effectively.
Additionally, a Gantt chart highlights task dependencies, showing which activities rely on others and when they should be completed in sequence.
Key Benefits of a Gantt Chart:
- Clear Project Visualization – Get an overview of project timelines and task progress.
- Track Deadlines – Easily monitor task completion and identify potential delays.
- Team Collaboration – Improve communication by keeping everyone aligned.
Gantt Chart Example
For a software development project:
- Task 1: Research and planning (Start: Jan 1, End: Jan 10)
- Task 2: Design and prototyping (Start: Jan 11, End: Jan 20)
- Task 3: Development (Start: Jan 21, End: Feb 15)
- Task 4: Testing (Start: Feb 16, End: Feb 25)
This structure helps project managers and teams visualize each phase, ensuring smooth execution and timely delivery.
Easy-to-Use Gantt Chart Template with Vabro
Creating a Gantt chart is simple with tools like Vabro, which offers ready-to-use Gantt chart templates that allow you to:
- Visualize project tasks and timelines
- Manage task dependencies efficiently
- Collaborate in real time with your team
Try Vabro today for seamless project tracking with Gantt charts and ensure your projects are delivered on time and with precision.