Develop A Gantt Chart
A Gantt chart is a graphical tool for project scheduling. It visualizes tasks over time, including their duration and dependencies. This helps project managers plan better and stay on track by tracking resource allocation and working precisely to meet deadlines. Below are the mandatory steps to follow when adding a Gantt chart to your next project, whether small or large.
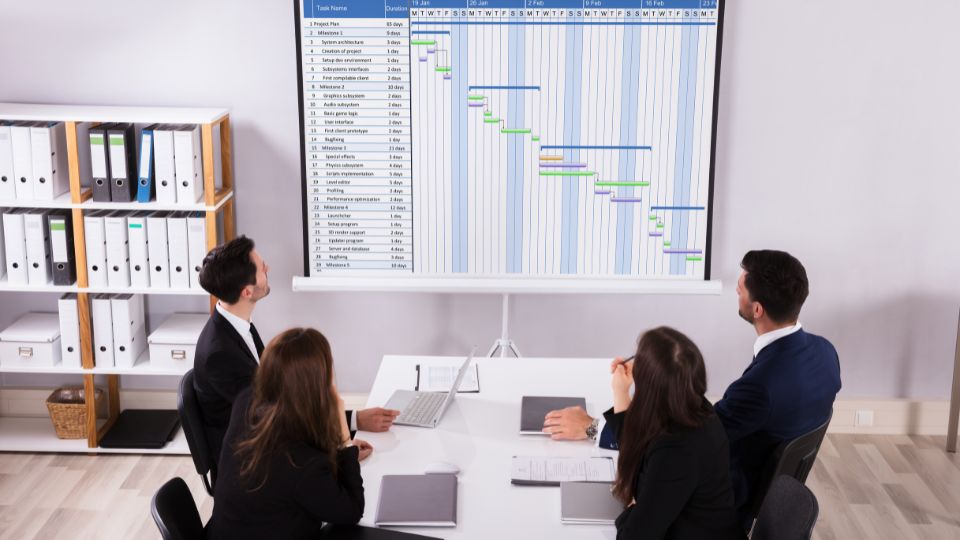
What is a Gantt Chart?
A Gantt chart is a type of bar chart used for project scheduling. Named after its creator, Henry L. Gantt, this tool displays your tasks in a timeline with start and end dates, as well as the connections between these tasks, all in the same view. Gantt charts are effective for seeing your project at a glance and understanding how everything is progressing across the timeline, helping you notice any bottlenecks or approaching deadlines in advance.
Steps To Create Gantt
Step 1: Specify Your Project
Before creating a formal Gantt chart, you need to define your project. Start by listing key objectives, deliverables, and tasks that need to be completed. Break the project into individual tasks and arrange them sequentially. This step is critical to ensure that the Gantt chart accurately represents your project timeline and dependencies.
Step 2: List the Tasks and Milestones
Once you understand the project scope, make a list of all activities. Don’t forget to include milestones—dates when significant progress or key phases are reached. Milestones, usually shown as diamonds in Gantt charts, help monitor project completion and track progress toward final deliverables.
Step 3: Define the Task Durations and Dependencies
Next, determine how long each task will take. This involves understanding the nature of tasks, available resources, and potential obstacles. Identify any dependencies—tasks that cannot begin until others are completed. Knowing these dependencies helps you figure out which tasks can overlap and when they should occur.
Step 4: Create the Gantt Chart
- Build the Timeline: Insert a timeline on your chart and highlight key days or time ranges.
- Add Tasks: List all tasks on one side of the chart, noting their start and end dates. Arrange them from top to bottom in order of urgency.
- Plot Task Durations: Draw horizontal bars to represent the duration of each task, from the start date to the end date.
- Represent Dependencies: Use lines or arrows to show tasks that depend on others. These indicate which tasks must be completed before others can start.
Step 5: Maintain the Gantt Chart
A Gantt chart should be updated regularly to reflect the current status of your project. As you complete, delay, or change tasks, adjust the chart accordingly. This helps ensure resources are allocated appropriately and schedules are adjusted to prevent further delays.
Vabro: Boosts Gantt Chart Production
Vabro is an excellent platform for creating and managing Gantt charts. With Vabro software, you can quickly build a project timeline and organize tasks using the Gantt chart feature. The platform also offers AI-driven insights for data analytics, helping you anticipate potential delays and avoid project setbacks. With its simple, intuitive interface, Vabro makes it easy to create and maintain Gantt charts throughout your project lifecycle.
Conclusion
Creating a Gantt chart is a core part of project management. It allows you to work with detailed accuracy, manage resources effectively, and stay on track. Tools like Vabro can further simplify this process, providing comprehensive Gantt charting and actionable insights. Whether you’re working on a quick task or need advanced planning, an effective Gantt chart is essential for monitoring and achieving your project goals.