Project Charts
In project management, you need to be able to see the data and follow up on it if you want success. That's why charts which illustrate the time lines, tasks and resources needed for a project are so important to any team's future. Project charts can provide insight and clarity whether you are in charge of a small functional group or overseeing an extensive -phase project. Through example we will also introduce what kinds these are and explain how Vabro makes their use more efficient.
The Importance of Project Charts in Project Management
Project charts are vital tools that help us see road maps for projects. They allow managers and teams to take in both the big picture of the project's progress thus far (Receipt 2013) as well as more detailed field views at a single glance. These charts have helped out with:
- Progress Tracking: Project charts enable monitoring of task progress. In this way, owners or managers can easily ensure that milestones are being met.
- Resource Management: Through the use of project charts, managers can assign resources equitably. This is the key to maintaining productivity and meeting deadlines: team members should not be lacking in work or suffocated by it.
- Risk Management: Project charts highlight potential bottlenecks and the operating environment intervals when delays will occur. The team can therefore identify risks early on, before they escalate. For both keeping things within budget, one must look at things from a pre-emptively prepared perspective - and these are prerequisites!
- Stakeholder Communication: Project charts effectively communicate to stakeholders the status of projects and any potential hitches. This way they are given a chance to make decisions objectively achieving that level of transparency which fosters trust but also ensures everyone is aligned with goals for their projects.
- Decision support: The data offered on project charts can help in making decisions. With a glance, managers can see what impact changes may have, reallocate resources as necessary and readjust milestones so the project stays on course.
Types Of Project Charts
There are many types of project charts. Each fulfills a certain function and has its own benefits. Some are mentioned below.
Gantt charts
As one of the most frequently used project management tools, Gantt charts are particularly noted for their picture of the schedule in a project. A start and finish date for any given task is shown on the Gantt chart, together with its dependencies. This visual timeline lets teams follow the sequence of activities and see how delays in one task might stall--or even halt--all future work on that project.
PERT Charts (Program Evaluation and Review Technique)
PERT charts are used to analyze the tasks required to complete a project, especially those that are schedule interdependent. The charts emphasize the critical path–the sequence of tasks with the shortest completion time for your project. By identifying this path, PERT charts help managers focus on those tasks that are necessary to success in your venture.
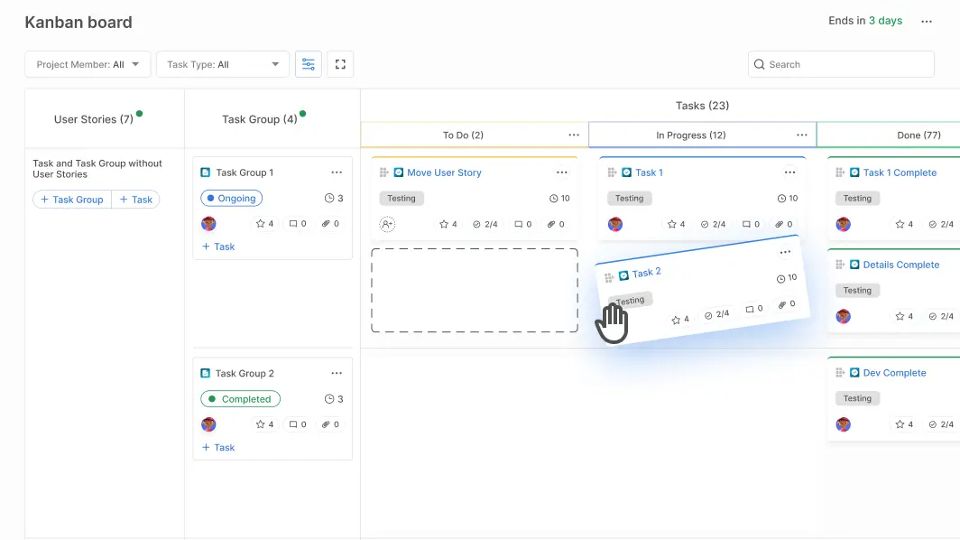
Kanban Boards
Kanban boards are used as a special-purpose chart in project management to give teams a visual representation of their work, limit work-in-progress and increase efficiency. In the beginning, you represent tasks by cards on a board, divided into columns such as "To Do," "In Progress," and "Done." As work progresses, cards are pushed from one column to another, offering an immediate view of where the project stands at all times.
Burn-Down and Burn-Up Charts
In Agile project management, people often use burn-down charts, which shows the amount of work that’s remaining. Burn-up charts, on the other hand, show the amount of work completed. Both charts help teams keep tracking and ensure that they are heading toward their goals.
Vabro Projects: Enhancing the Power of Project Charts
The traditional project charts offer great advantages. But modern tools like Vabro Projects take this advantage to a new height by integrating powerful project chart features into a user-friendly platform. This makes it easier than ever to plan, track, and manage projects with your team or on your own.
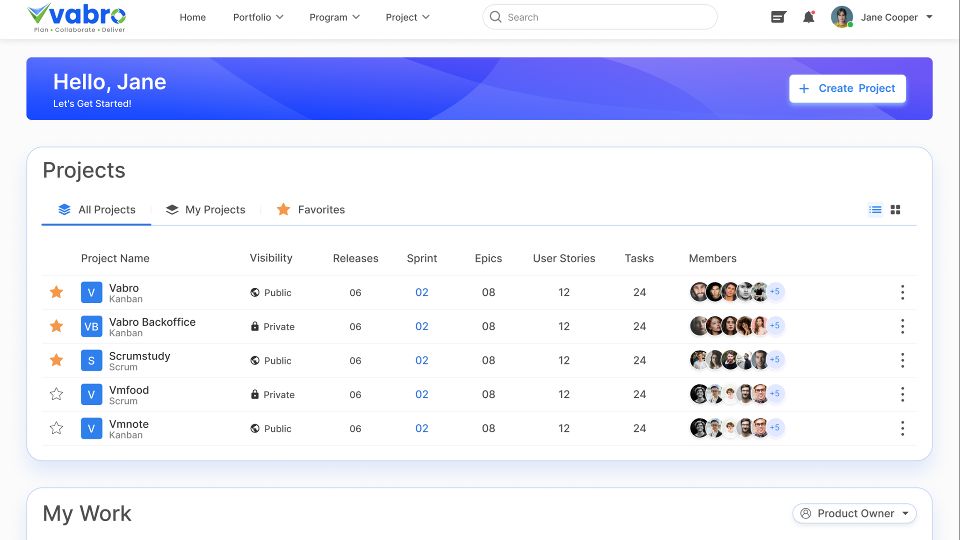
Customizable Dashboards: Vabro Projects lets you create your project exactly the way that suits you with fully customizable dashboards. The Gantt chart, the Kanban board, or a combined burn-down chart all fit perfectly in one chart. When it comes to organizing information, Vabro provides support for whatever way is most comfortable for individual projects and their managers.
Real-Time Collaboration: One of the exceptional features of Vabro Project is its real-time collaboration functions. Team members can update tasks, add comments to cards on a Kanban board — all live. This means that anyone can always print out their work schedule right from the website and problems will be addressed just as soon as someone notices them.
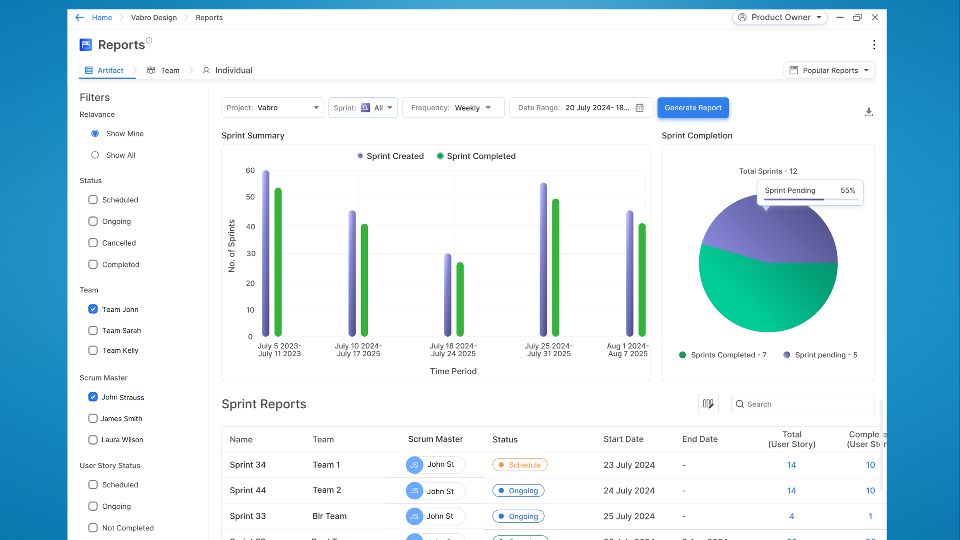
Automated Reporting: By simplifying report generation with automated reporting features, Vabro Projects saves you time and reduces frustration. Reports containing Gantt charts, PERT charts, and other project data are easily prepared. From start to finish everything about this automation is designed to save time while guaranteeing reports are always accurate, up to date and in the right hands.
Integrated services with Agile Methods: Vabro Projects allows teams utilizing Agile methodologies to be effectively integrated with both Scrum and Kanban. You’ll be able to have sprints, follow user stories, and view how much work is left on a chart, all given within one site.
Scalability and Flexibility: Vabro Projects is designed to handle a large project or a small portfolio of projects. The tool flexibly adapts to different project charts with the development of your project, letting you have just the right range of tools at your disposal.
Conclusion
Project charts are indispensable tools in the field of project management. They provide the clarity and insights that are needed to keep projects on track. Each type of project chart, from a Kanban board to Gantt charts, offers its own unique benefits for helping teams visualize progress, allocate resources and make informed decisions. But the true potential of project charts is realized only when they are incorporated into a comprehensive project management tool such as Vabro Projects.
Vabro Projects realizes project charts potential by combining its flexibility and usability, seamless integration with Agile methodologies, real-time collaboration features and intelligent reporting. No matter if you are a project manager or team member, stakeholder or customer, Vabro Projects gives you the facilities to ensure that your projects are delivered on time and within budget, to the best quality standards possible.
With Vabro Projects you not only have access to powerful project charts but also enjoy a platform designed for growth and adaptability in tune with your team throughout its lifetime. Get started with Vabro Projects now and experience the difference that a truly modern project management tool can make.