Make Free Gantt Chart Online
Understanding Gantt Charts: The Key to Visual Project Management
A Gantt chart is a powerful project management tool that visually represents a project’s timeline, showing tasks, dependencies, and deadlines in a bar chart format. Originally developed in the early 20th century, Gantt charts remain relevant and widely used today for their ability to help teams track project progress and manage time effectively. Here’s how Gantt charts work and why they’re essential for modern project management.
What is a Gantt Chart?
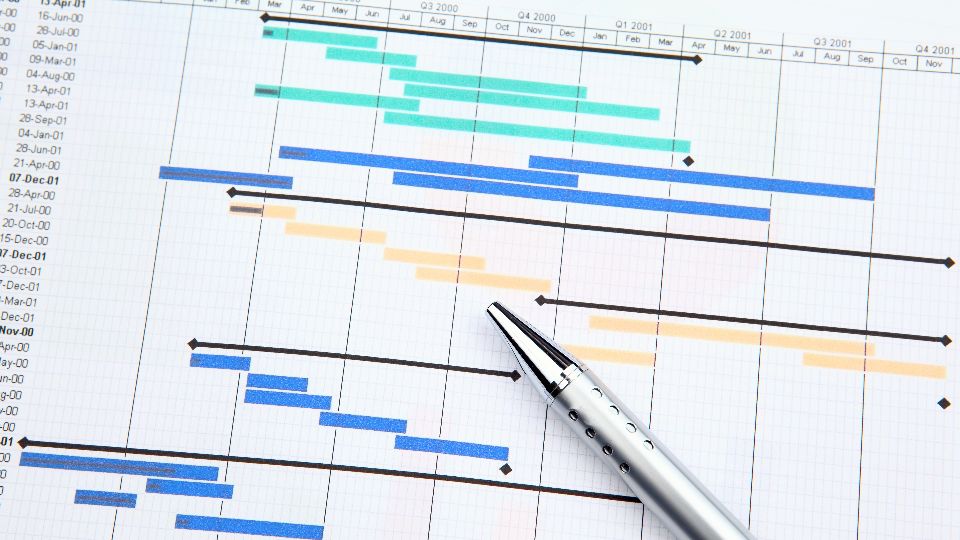
A Gantt chart displays project tasks along a timeline, with each task represented by a horizontal bar that spans the task's start and end dates. Tasks are laid out in sequential order, creating a visual representation of the entire project from start to finish. Gantt charts make it easy to see which tasks need to be completed at any given time, allowing project managers and team members to plan efficiently.
Key Components of a Gantt Chart
1. Task Bars and Duration Each task is represented by a bar, with the length of the bar indicating the task’s duration. By viewing all tasks on one chart, teams can assess the project’s overall timeline and focus on time-sensitive activities.
2. Milestones and Deadlines Milestones mark significant points or deliverables in the project. These are represented as symbols (often diamonds) and show critical checkpoints to help teams gauge progress. Milestones allow teams to track deadlines and focus on achieving specific goals.
3. Dependencies and Linked Tasks In many projects, certain tasks must be completed before others can begin. Gantt charts allow project managers to set dependencies, creating links between tasks to show their relationships. This feature helps teams manage workflows and avoid bottlenecks.
Benefits of Using a Gantt Chart
1. Enhanced Project Planning Gantt charts offer a high-level overview of the project’s timeline, helping project managers plan, allocate resources, and adjust schedules as needed. This overview is essential for tracking timelines and balancing workloads.
2. Improved Team Communication By clearly illustrating task sequences and dependencies, Gantt charts promote better communication among team members. Everyone can see who is responsible for what, ensuring alignment and collaboration.
3. Efficient Time Management With a visual layout of tasks and deadlines, Gantt charts help teams stay on track, identify potential delays, and make necessary adjustments before they impact the project.
Conclusion
A Gantt chart is an indispensable tool for project management, providing a clear roadmap of tasks, timelines, and dependencies. Whether for small teams or complex projects, Gantt charts offer structured, visual guidance to keep teams aligned and projects on schedule.