Gantt Chart Google Sheets: A Guide to Project Planning
One of the popular tools used for project planning is Gantt chart which shows a visual timeline of tasks. Building a Gantt chart in Google Sheets is useful for teams to keep an eye on the progress and deadlines of projects. Though Google Sheets is an easy way to create Gantt charts, and for advanced project management tools such as Vabro. It will make your process of managing projects smoother, while also giving you more power over sorting complex issues.
How to make a Gantt Chart in Google Sheets
Now, Gantt charts can be made on Google Sheets — it's very flexible in using as your own way of doing the project. This is how you can easily create a Gantt chart using google sheets;
Create Your Spreadsheet: Open a new Google Sheets doc. If we were to make a Gantt chart of Time Southeast, these could be the columns (task name, start date, end date and duration)
Fill in Your Data: Input your project tasks and their start/end dates into the spreadsheet. Follow This Step to make each task very specific, with actual dates of inputs released.
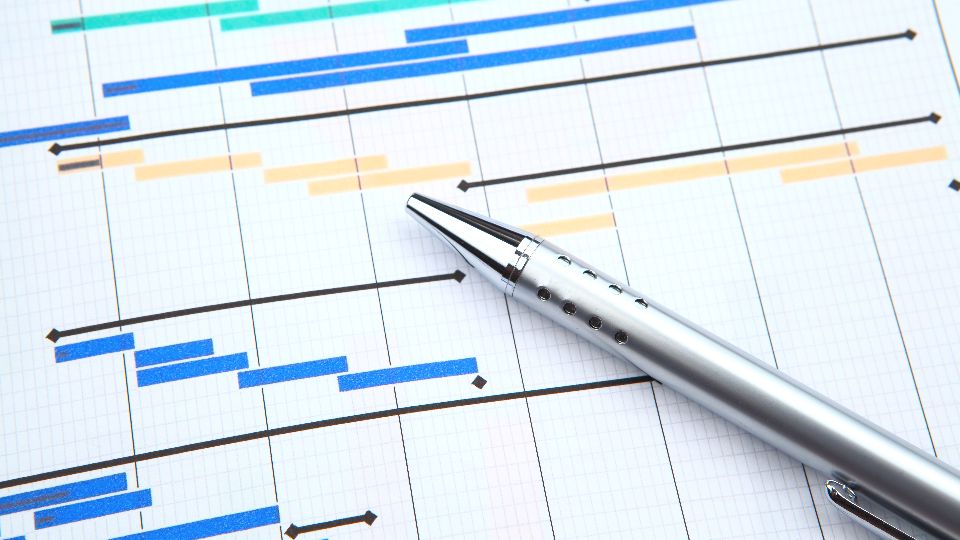
Draw a Bar Chart: Highlight the range of your tasks and dates. Go to Insert, and then Bar chart. It will be the foundation of your Gantt chart.
Make Your Chart Your Own: Orient the chart to show tasks as horizontal bars. Customize the bar colors and type of chart to convey the project timeline visually effectively. You can probably create the bar lengths and exactly align their positions about start, end dates among them.
Provide More Information: Add dependencies, dates milestones, and color markers to your Gantt chart. Additional columns or annotations can be used to indicate the status of your project.
And in some more advanced features needed for complete project management, Google Sheets is very limited. With its experience, Vabro would be able to bring substantial benefits.
Vabro vs. Google Sheets for Project Management
Now, while Google Sheets can do some rudimentary Gantt-style functionality, Vabro also provides a range of additional features along with its project management capabilities to help you keep your projects under control. So, here is how Vabro can transform your project management experience better than Google Sheets.
Advanced Gantt Charts: Vabro offers sophisticated, built-in plugins that provide advanced features and functionalities like task interdependencies, computed critical path analysis, & dynamic timeline modification. For example, you can set up more accurate project planning and scheduling than the manual approach with Google Sheets.
Collaboration in real time — Vabro allows team members to collaborate on plans by updating them all at the same time. If you do use Google sheets or the like, it must be updated manually in most cases, with Vabro, your team is always working off of new content.
Full Project Views: Vabro provides full project views by weaving Gantt charts into other popular project management tools like Kanban boards, task lists, and resources. This integrated view gives you a comprehensive understanding of the health and utilization data for your project.
Automated updates and reminders — Vabro sends you automated updates right to your inbox, regarding project milestones, tasks completed or approaching deadlines. This upfront approach effectively assures that all projects are progressing well without the need to constantly monitor and intervene manually.
Customizable Dashboards — Vabro: Design your own dash or dashboards for the creation of tailored views over different project data. Dashboard for key metrics, progress report and Gantt chart module as per your project management requirement
Integration with Other Tools - There are many tools and platforms that you can use in the Vabro which allows for data synchronization between different applications. This integration makes sure that your Gantt charts and project data are synchronized across other activities involved in the management of projects.
Improved Reporting and Analytics: Vabro offers advanced levels of reporting and analytics which provides additional insights about the performance of projects. Instead of forcing you to analyze the data using Google Sheets, its reporting tool is automatically orchestrated with a single click providing comprehensive reports and visualizations.
Conclusion
Vabro allows users to build a drastically better project management experience compared to creating Gantt charts in Google Sheets. Vabro significantly improved Gantt charts, real-time collaborations, and complete project views. With Vabro, you can put the constraints of Google Sheets behind and utilize a properly featured project management solution to track high level or granular projects with sureness.