gantt chart generator
Gantt Chart Generator: An Optimal Way to Visualize Project Timelines for Effective Management
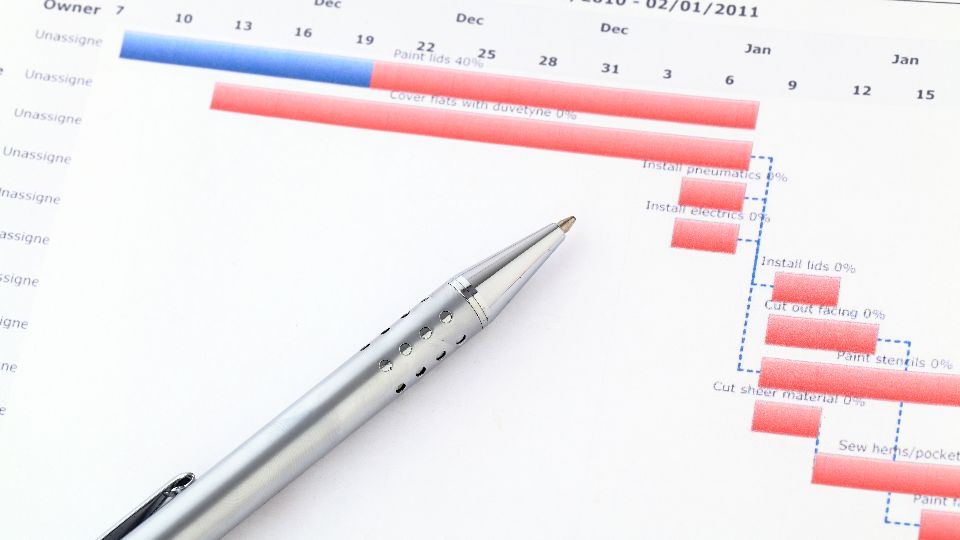
A Gantt chart generator is a handy tool for project managers who use it to graphically represent the timeline of projects, keep track, and ensure that tasks are met within deadlines. One of the key virtues of Gantt charts is that they give you a way to see your timeline in front of you—whether on paper or screen, teams find them instrumental in their ability to get organized and stay that course throughout long projects.
A Complete Solution: Vabro Gantt Chart Generator
Vabro provides a robust Gantt chart generator designed quickly for modern project management requirements. Vabro enables project managers to generate highly detailed Gantt charts from their task schedules, providing a visual snapshot of all tasks and milestones with due dates. Its easy-to-use interface lets users drag and drop tasks, adjust timelines, and assign responsibilities with the smoothness you can expect from a project planning experience.
A unique functionality of the Vabro Gantt chart generator is that it can pull in real-time data and updates, making your Gantt chart always live. Therefore, PMs can quickly identify risk points and handle them before they hinder on-time delivery. Vabro makes any view in a template customizable, allowing teams to easily highlight the sections of projects that are being worked on at certain times while providing more flexible project management options.
Gantt Generator with Collaboration in Vabro
Everyone can view and work simultaneously on the Gantt chart over this platform, with no barrier to keeping track of what is being done at another end. It can be applied for big teams but also to facilitate interactive communication with staff at various locations (decreasing the risk of miscommunication or misinformation).