Gantt Chart Example: Visualizing Project Timelines Effectively
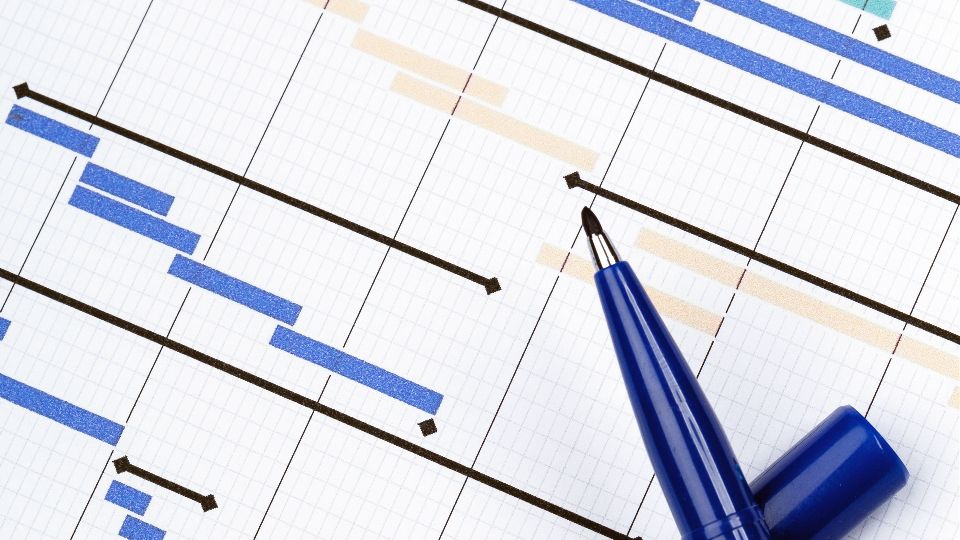
A Gantt chart is the most popular tool for providing a visual representation of your project timeline, including tasks, their dependencies, and milestones. With tasks laid out on a timeline, project managers can easily view how different pieces of the project are interconnected, understand where resources have been spent, and see what comes next.
Why Vabro is Great for Expanding Gantt Charts
Vabro is not a replacement for other tools; it does something that Google Calendar and Trello cannot: make Gantt charts less complicated—or, at the very least, faster to generate. Here’s how Vabro makes the most out of Gantt charts and transforms them into a more powerful tool for your team:
Customizable Gantt Chart Examples
With Vabro, you can create Gantt charts tailored to the specific needs of your project. For example, if you’re managing a software development project, your Gantt chart might include tasks like requirements gathering, coding, testing, and deployment. Vabro allows you to customize each task, set dependencies, and assign resources, all within an intuitive interface.
Real-Time Updates and Collaboration
Traditional Gantt charts can quickly become outdated if not regularly updated. Vabro solves this problem by enabling real-time collaboration. As team members update their progress on tasks, the Gantt chart automatically reflects these changes, ensuring that everyone has access to the most up-to-date information. This feature is especially useful for teams working in different time zones or remotely, where communication and coordination are key.
Detailed Examples for Every Project Type
Whether you’re managing a marketing campaign, a product launch, or an event, Vabro offers detailed Gantt chart examples that you can adapt to your project. For instance, an event planning Gantt chart in Vabro might include tasks such as venue booking, vendor coordination, promotion, and event day logistics. Each of these tasks can be broken down into subtasks, with clear deadlines and assigned team members, making the project more manageable.
Task Dependencies and Critical Path Analysis
One of the key features of a Gantt chart is the ability to visualize task dependencies—how the completion of one task affects the start of another. Vabro enhances this feature by allowing you to conduct critical path analysis directly within the platform. This helps you identify the sequence of tasks that will directly impact your project’s timeline, enabling you to allocate resources more effectively and avoid delays.
Scalability Across Projects
Vabro’s Gantt charts are not just for small or simple projects. The platform is designed to scale, meaning you can use it for everything from short-term tasks to long-term, complex projects. Whether you’re managing a project with a handful of tasks or one with hundreds, Vabro’s Gantt charts remain clear and easy to navigate.
Integration with Other Vabro Tools
Vabro’s Gantt charts are seamlessly integrated with other tools within the platform. For example, if you’re using Vabro’s task boards, calendar view, or resource management tools, any updates made in one area are automatically reflected in the Gantt chart. This integration ensures that all aspects of your project management are synchronized, reducing the risk of errors and improving overall efficiency.
Easy-to-Understand Visuals
Vabro’s Gantt charts are designed with user-friendliness in mind. The visuals are clean and straightforward, making it easy for team members and stakeholders to understand the project’s progress at a glance. This is particularly valuable when presenting project updates to clients or executives who may not be familiar with the day-to-day details but need a clear overview of the project’s status.
Practical Examples to Get Started
To help you get started, Vabro provides practical Gantt chart templates and examples that you can customize to suit your needs. Whether you’re new to Gantt charts or an experienced project manager, these examples serve as a solid foundation that you can build upon, ensuring that your projects are well-planned and executed efficiently.
Conclusion
A Gantt chart is a formal model of the workflow in a project, showing how much time one process or person takes to complete and when they are executed. But its real power occurs when you pair it with a complete project management platform like Vabro. With customizable templates, real-time collaboration, and seamless integrations with your other tools in the stack—Vabro ensures that your Gantt chart is not just a passive, fixed timeline but an active, interactive building block of your complete project management strategy.
Vabro’s Gantt charts help you, whether managing a small team or a large project, to keep track of your progress and hit deadlines. Vabro is more than just a fancy Gantt chart; it is a robust tool that will adjust your way of working along with the growth and success of your projects.
