Asana Gantt Chart
Gantt charts are a cornerstone in project management and depict a visual timeline that represents the program of a project. Originated by Charles Babbage in the 1860s, Gantt charts now have become an indispensable tool for managing projects. They may be used to schedule, monitor, and coordinate projects of any size behind-the-scenes engineering work, or top creative activity on a grand scale; Its simple effectiveness has enabled Gantt charts to be of particular help in fields such as construction and engineering and also software development and marketing. These are the notable features of Gantt charts.
What is a Gantt Chart?
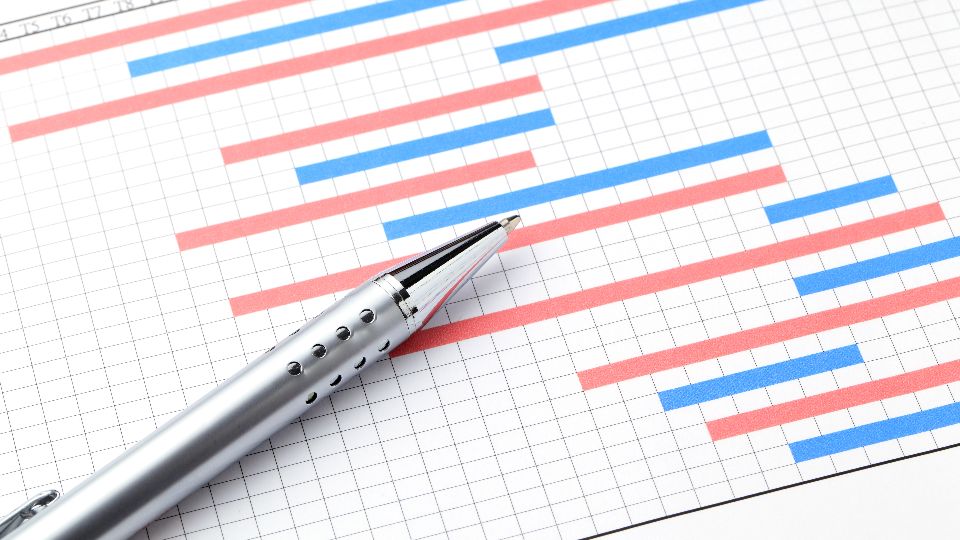
At its most basic, a Gantt chart is a bar chart that visually represents a project schedule. The horizontal axis generally indicates time and the vertical axis represents the tasks or events which must be completed. Each task is shown as a bar, with the length of the bar reflecting how long it takes to complete that particular aspect. The chart displays the start and end dates of individual tasks visually, as well as their sequence and interdependencies, enabling project managers to see at a glance how numerous tasks intersect and impinge on one another.
Challenges and Considerations
While Gantt charts are extremely helpful tools, they are not without major drawbacks. One possible disadvantage is that they may become complex and unwieldy in large projects, task-filled, or with large chain-of dependencies. In addition, generating and upkeeping a Gantt chart can be time-consuming – particularly on a project undergoing frequent changes or when there are multiple projects at different stages to be managed.
The difficulty can be mitigated by using project management software that automates the design and maintenance of Gantt charts for you. Tools such as Vabro, Microsoft Project, Asana, and Trello are now equipped with Gantt charts, allowing even the most complex projects to be managed easily.
Benefits of Using Gantt Charts
Gantt charts offer several important advantages that help them to be used as effectively as possible in project management:
- Clarity and Organization: Gantt charts provide a clear overview of the project's timeline, tasks, and dependencies. This makes work easier to organize and resources more efficient for allocation.
- Improved Communication: The visual nature of Gantt charts helps stakeholders understand the project status. This makes it easier for different groups within an organization to communicate and work together towards better results.
- Time Management: By clearly marking out the start and end dates of tasks, Gantt charts help project managers make sure that the project is kept on schedule. Should there be a need for adjustments later, they can be made in good time.
- Tracking Progress: Gantt charts enable project managers to track progress in real-time. As tasks are completed, the chart can be updated to reflect the current status, making it easier to identify delays or potential bottlenecks.
Conclusion
Gantt charts are powerful weapons for project managers because they provide an ordered way to plan, track, and manage projects. By showing project schedules, tasks, and interdependencies, the Gantt chart ensures projects will be carried out on schedule and within scope. Although they have their drawbacks and difficulties, the advantages well outweigh them making Gantt charts an indispensable part of modern project management.