Agile Project Management Metrics
Tracking the right performance metrics in Agile project management is essential to ensure teams deliver value efficiently and continuously improve. These metrics help teams monitor progress, identify bottlenecks, and measure overall project success. Below are the key Agile performance metrics that every project manager and Agile team should track.
1. Sprint Burndown Chart
A sprint burndown chart visually represents the remaining work in a sprint over time. It tracks how many tasks or user stories are yet to be completed.
- Why It Matters: It provides a clear view of progress and helps teams identify if they are on track to meet sprint goals.
- How to Use: Compare the actual progress line against the ideal line. If the actual line lags behind, the team may need to adjust their workload or address challenges.
2. Velocity
Velocity measures the amount of work a team completes in a sprint, typically quantified in story points or tasks.
- Why It Matters: It helps forecast how much work a team can realistically accomplish in future sprints.
- How to Use: Track the team’s velocity over multiple sprints to identify patterns and set achievable goals.
3. Lead Time
Lead time is the total time taken from the moment a task is created until it is completed.
- Why It Matters: It reflects the overall efficiency of the team and the workflow process. Shorter lead times indicate higher efficiency.
- How to Use: Analyze lead time for tasks or user stories and work to eliminate delays, such as unnecessary handoffs or bottlenecks.
4. Cycle Time
Cycle time measures the duration it takes for a task to move from “In Progress” to “Done.”
- Why It Matters: It highlights the team’s ability to deliver work quickly and identifies inefficiencies in specific stages of the workflow.
- How to Use: Monitor tasks with unusually long cycle times to identify areas for improvement.
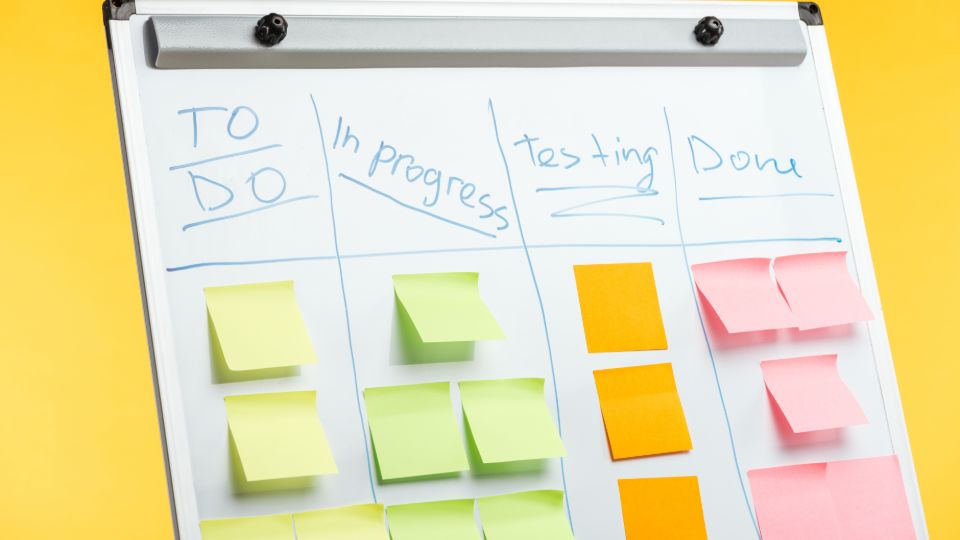
5. Cumulative Flow Diagram (CFD)
A cumulative flow diagram visualizes the number of tasks in different stages (e.g., To Do, In Progress, Done) over time.
- Why It Matters: It provides insights into workflow stability, bottlenecks, and team capacity.
- How to Use: Look for sections of the chart where tasks accumulate, as this indicates bottlenecks or overloaded team members.
6. Burnup Chart
A burnup chart shows completed work against the total scope of work, providing a clear picture of progress.
- Why It Matters: It highlights scope changes while tracking how much work remains.
- How to Use: Use burnup charts to communicate progress to stakeholders and ensure goals are on track.
7. Escaped Defects
Escaped defects refer to issues that make it past testing and into production.
- Why It Matters: Fewer escaped defects indicate better quality control and testing processes.
- How to Use: Track defects and implement continuous testing practices to reduce their occurrence.
8. Team Happiness
Team happiness is a qualitative metric that measures team morale, satisfaction, and well-being.
- Why It Matters: Happy, motivated teams tend to perform better and produce higher-quality work.
- How to Use: Conduct regular surveys or retrospective discussions to gauge team sentiment and address concerns promptly.
9. Release Burndown
Release burndown charts track progress toward a major release by showing completed work against the release scope.
- Why It Matters: It helps teams and stakeholders understand if they’re on schedule to deliver the release on time.
- How to Use: Use this metric to assess whether adjustments to timelines or priorities are necessary.
10. Throughput
Throughput measures the number of tasks or user stories completed in a given time period.
- Why It Matters: It indicates team productivity and the rate at which tasks are being delivered.
- How to Use: Compare throughput across sprints to assess performance trends.
Conclusion
Tracking these Agile performance metrics ensures teams can optimize workflows, improve quality, and deliver value consistently. Metrics like sprint burndown, velocity, and cycle time provide actionable insights, while qualitative measures like team happiness ensure a balanced approach to success. By monitoring and improving these key metrics, Agile teams can achieve better collaboration, efficiency, and project outcomes.